Content
- Where is the manual?
- How do I export graphics?
- How do I organize data into groups?
- How do I reference Past?
Where is the manual?
 How do I export graphics?
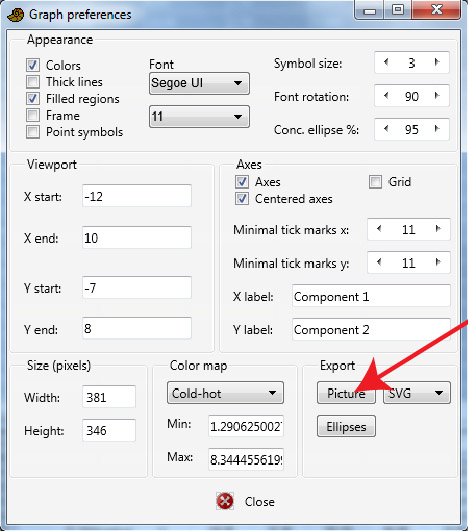
For publication quality figures, I suggest saving the graphic in the SVG vector format. Click the "Graph settings" button next to the graphic. In the graph preferences window, click the "Export picture" button (see right). On Mac, you must add the file extension (such as .svg) manually to the file name.
You can open and edit the SVG file in Illustrator, Corel Draw or Inkscape. SVG files are also supported by most web browsers, and can be placed directly on a web page. You can also save as PDF.
You can also export the picture in bitmap formats (JPG, TIF etc.), but the quality is not so good and you can not easily edit the graphic. Or you can copy-paste the image as a bitmap with the "Copy" button under the graphic.
How do I organize data into groups?
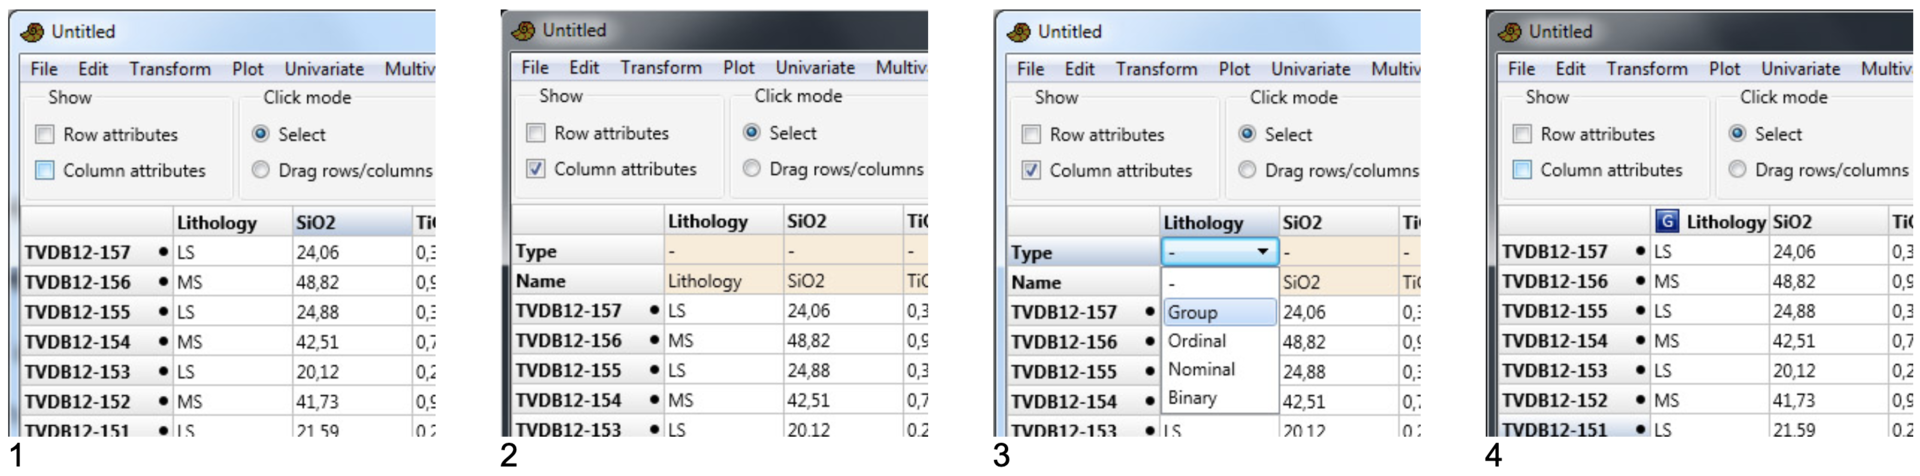
Many analyses require that you specify groups. This requires a separate group column, containing a group identifier for each row. In the example below (1), there is a group column called "Lithology", with two groups LS (limestone) and MS (marlstone). To tell the program that "Lithology" is a group column, first select the "Column attributes" box above the spreadsheet. This will bring up two extra rows at the top of the spreadsheet (2). Then click a few times on the "Type" cell of the group column, to bring up a small menu where you can select "Group" (3). Then click somewhere else on the spreadsheet to update, and you can deselect "Column attributes" if you wish. The group column should now be marked with a G (4).
How do I reference Past?
Hammer, Ø., Harper, D.A.T., Ryan, P.D. 2001. PAST: Paleontological statistics software package for education and data analysis. Palaeontologia Electronica 4(1): 9pp.